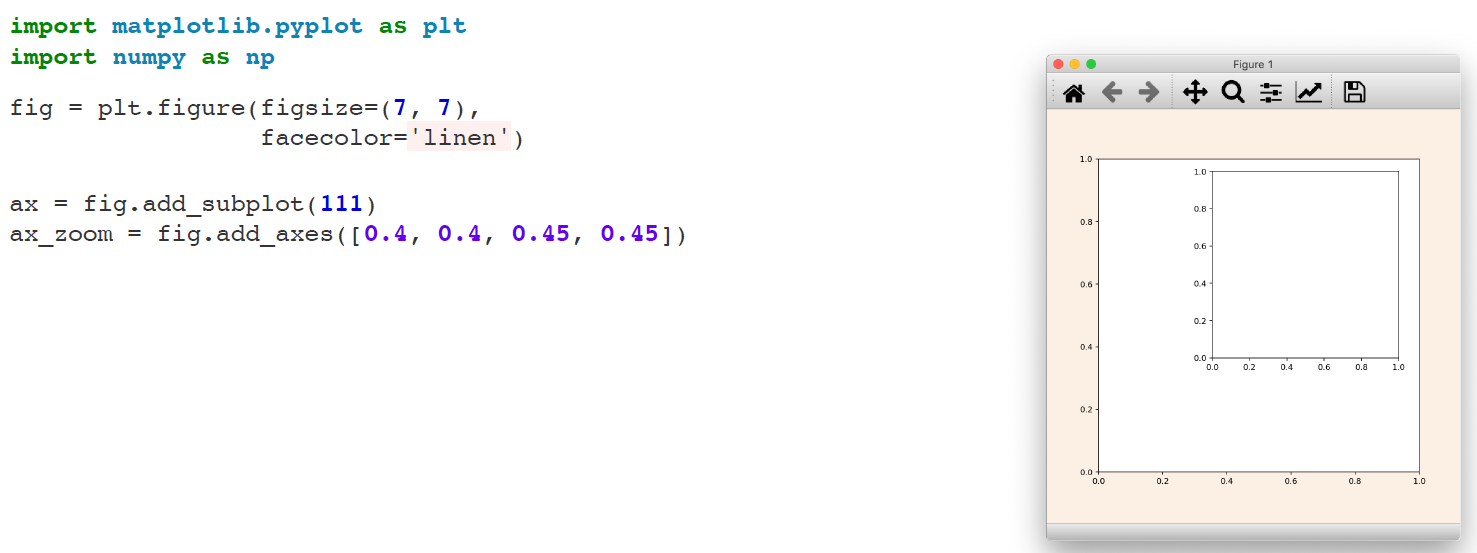
Figures and Axes
- 하나의 도화지를 Figure, 그 안에 그린 그래프 한 개를 ax, 그래프 ax의 모음을 axes
1. Making Figure (도화지 정하기)

import matplotlib.pyplot as plt

fig = plt.figure()
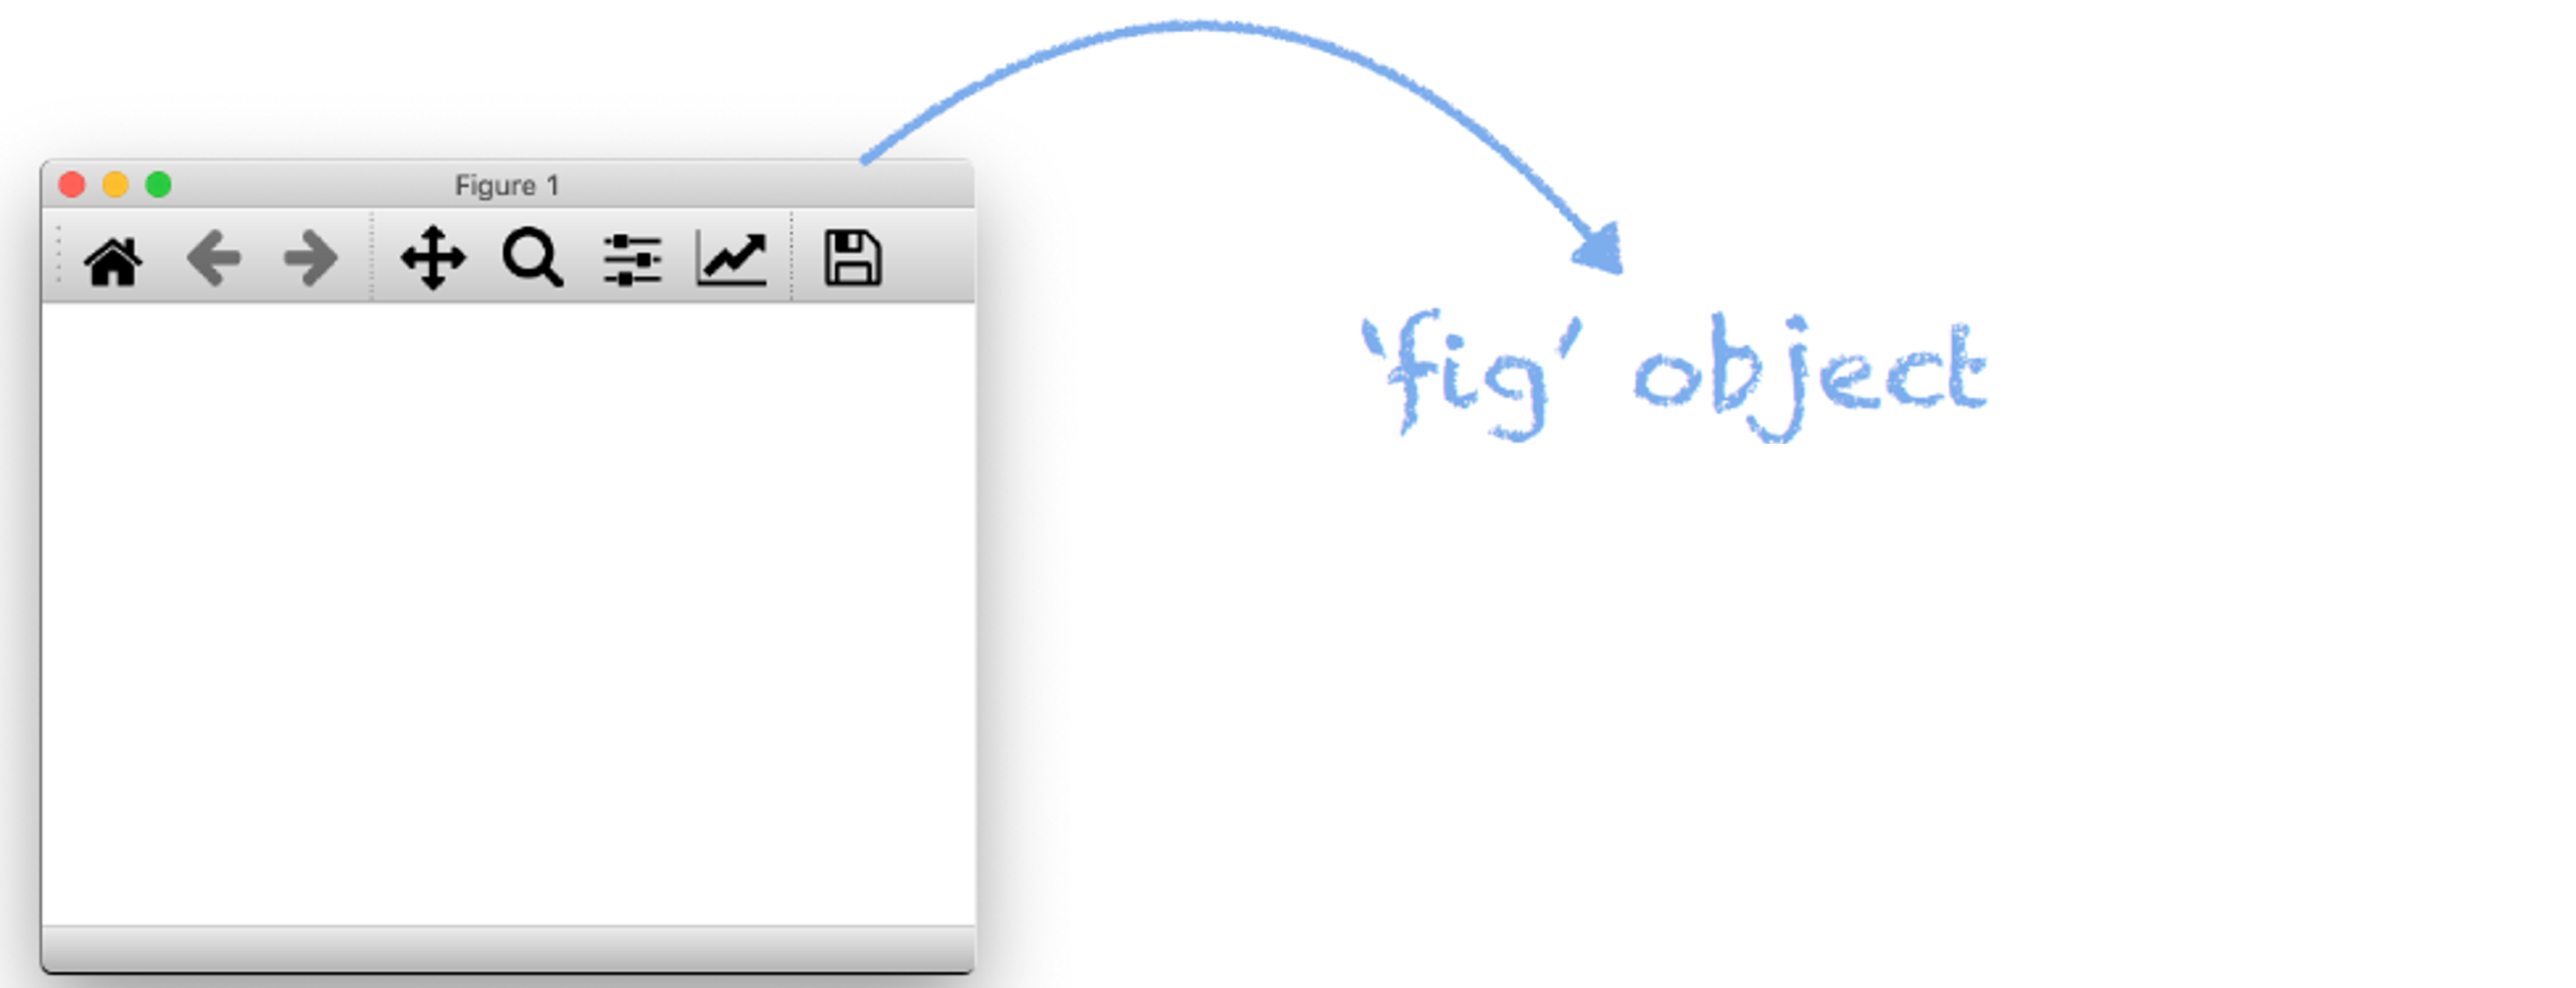
이렇게 하고나면 ‘fig’ object에 다양한 메소드들을 활용할 수 있게 된다.
# 그림의 크기
fig = plt.figure(figsize=(가로, 세로))

# 배경 색깔
fig= plt.figure(facecolor=named color (ex. linen) or base color (ex. r) or RGB((0.5, 0.1, 0.1)))
2. Adding Subplots (그림을 그릴 공간을 객체로 만들기)
자주 사용되는 메소드로 add_subplot()이 있다. 새로운 ax객체를 만들어 준다.

fig = plt.figure()
ax = fig.add_subplot()
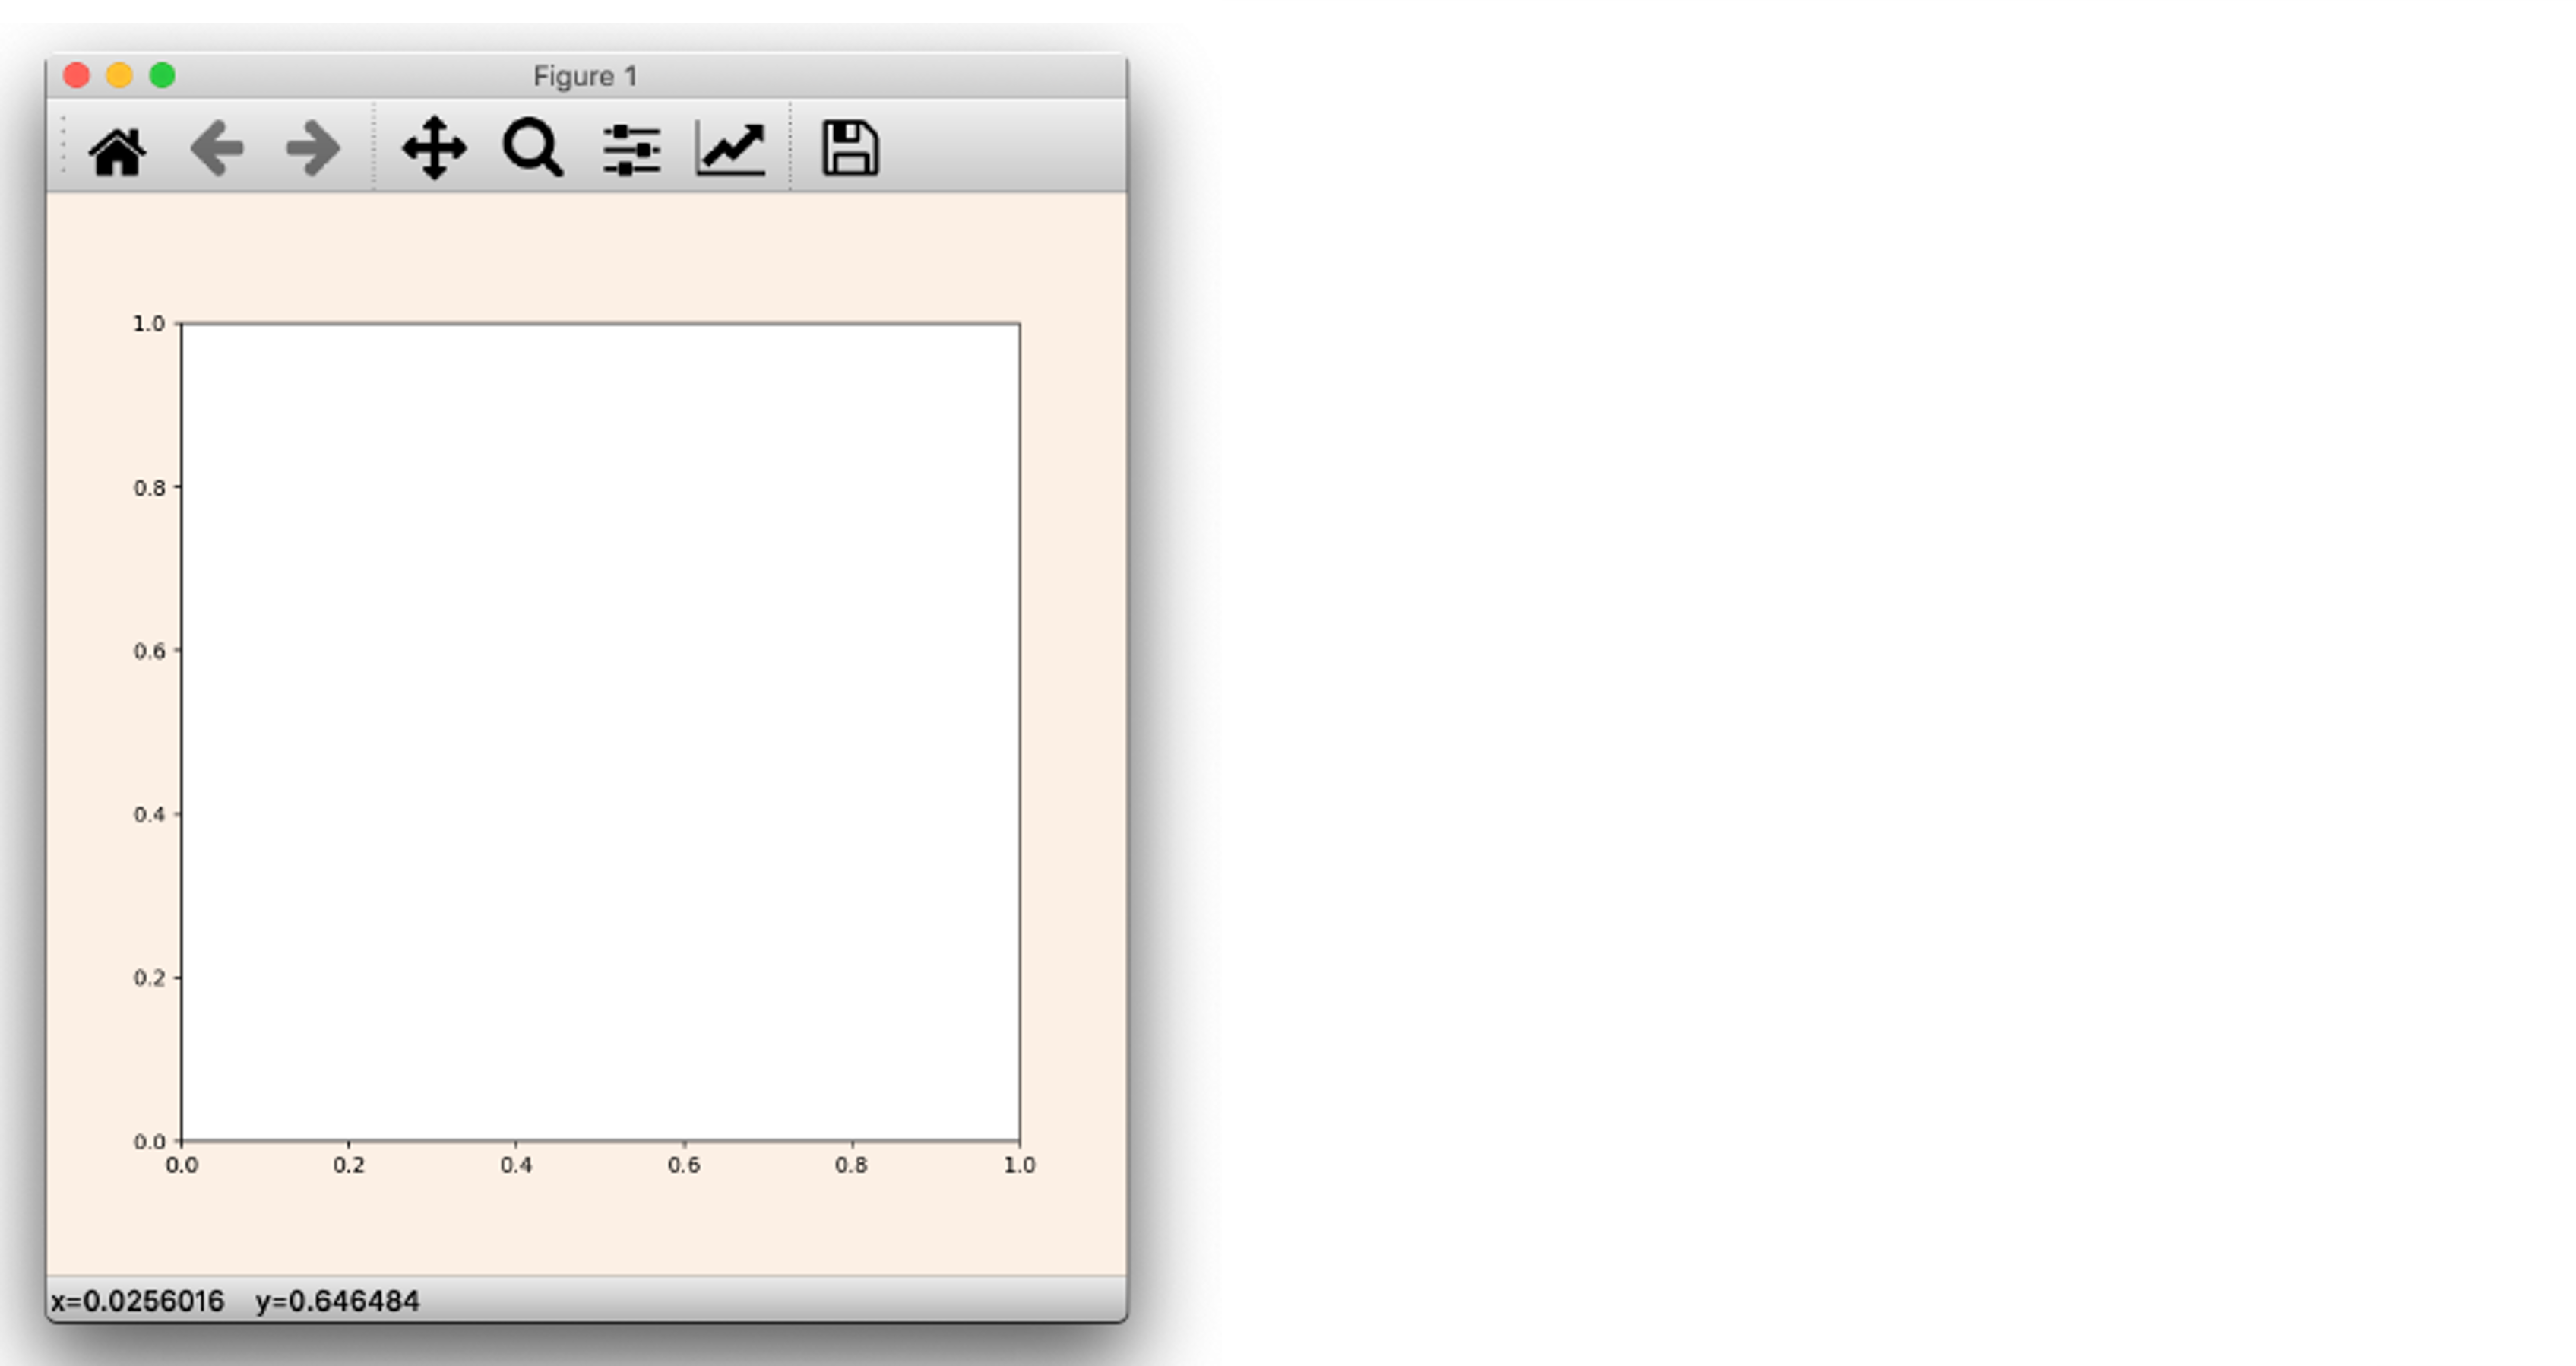
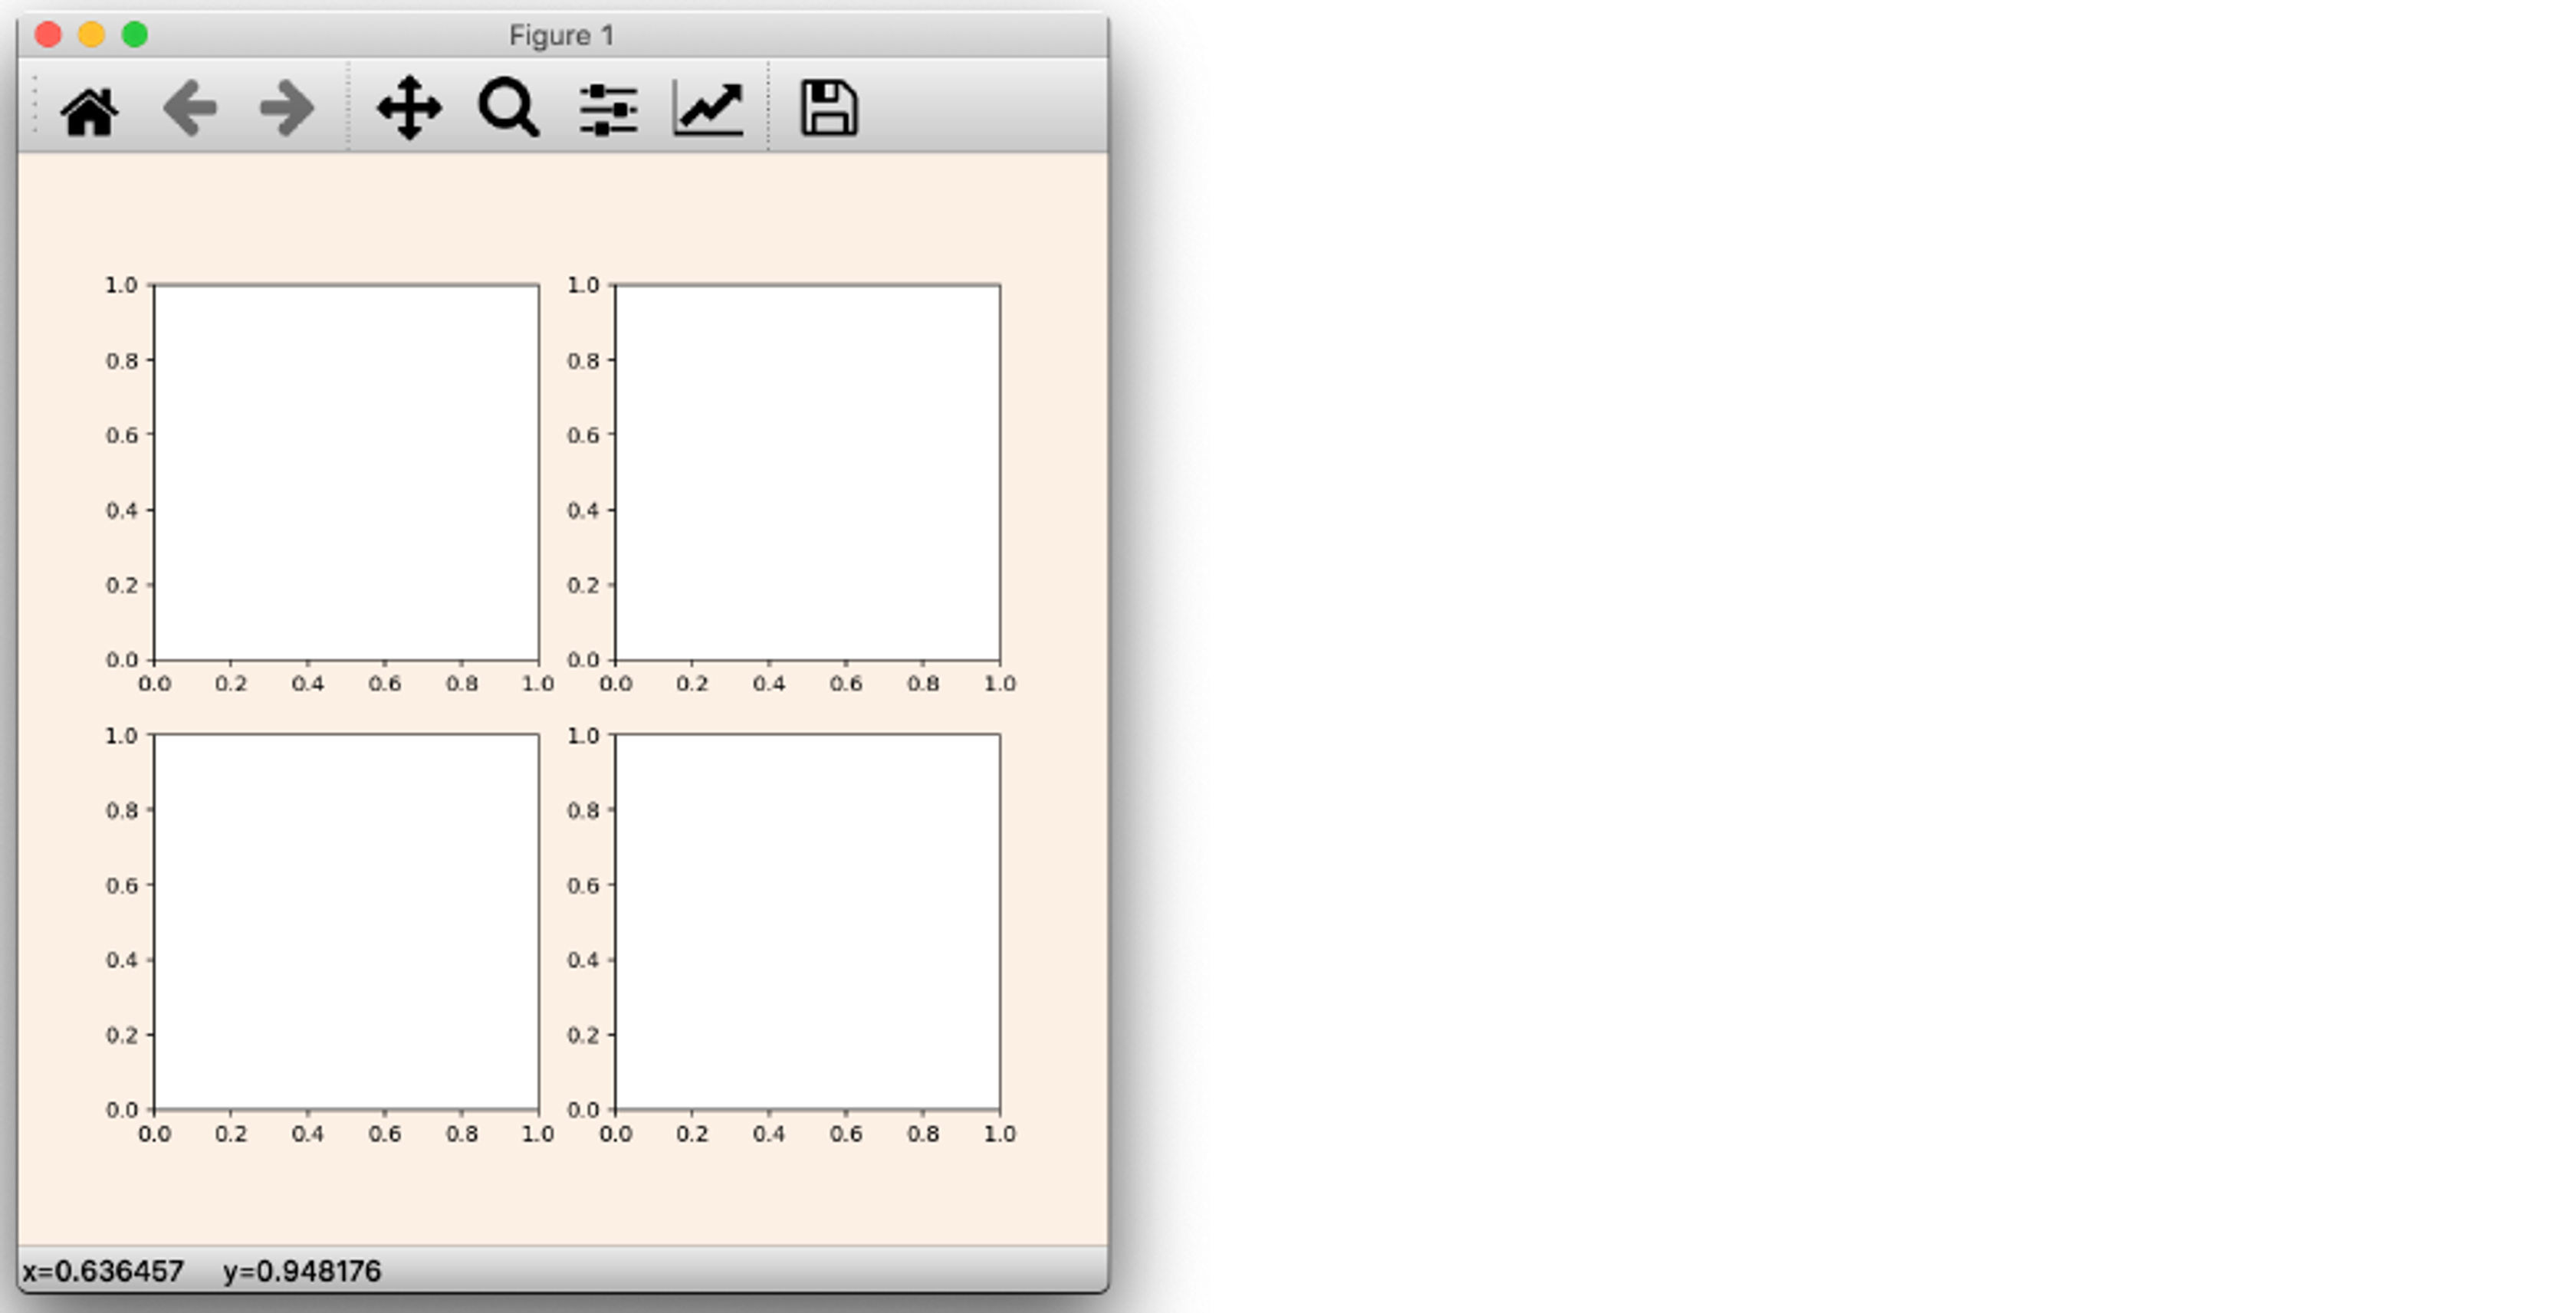
add_subplot()으로 한 번에 여러 공간을 객체로 만들 수 있다.
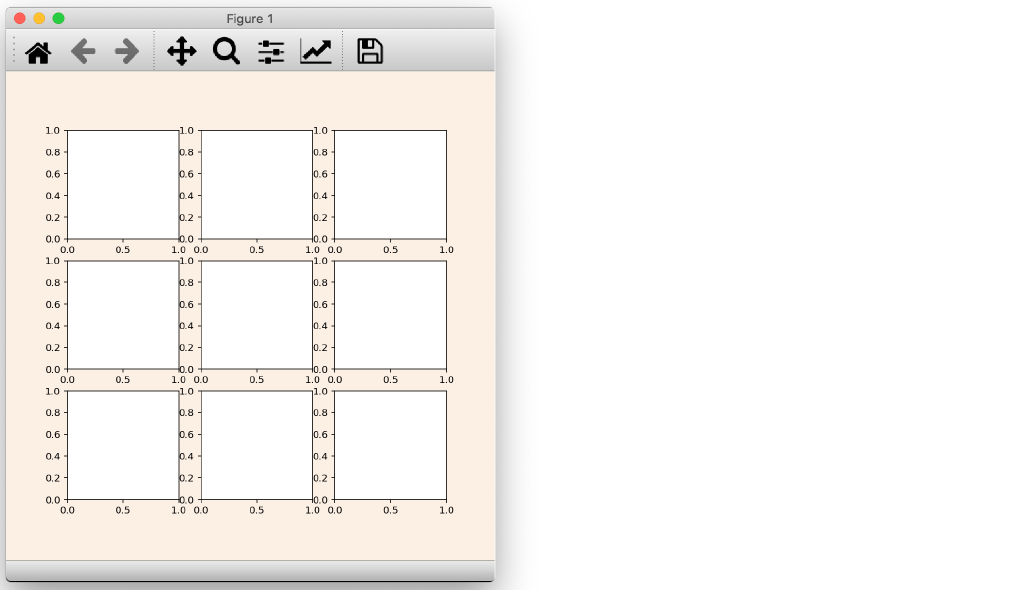

fig = plt.figure(figsize=(7, 7), facecolor='linen')

ax1 = fig.add_subplot(221)
ax2 = fig.add_subplot(222)
ax3 = fig.add_subplot(223)
ax4 = fig.add_subplot(224)
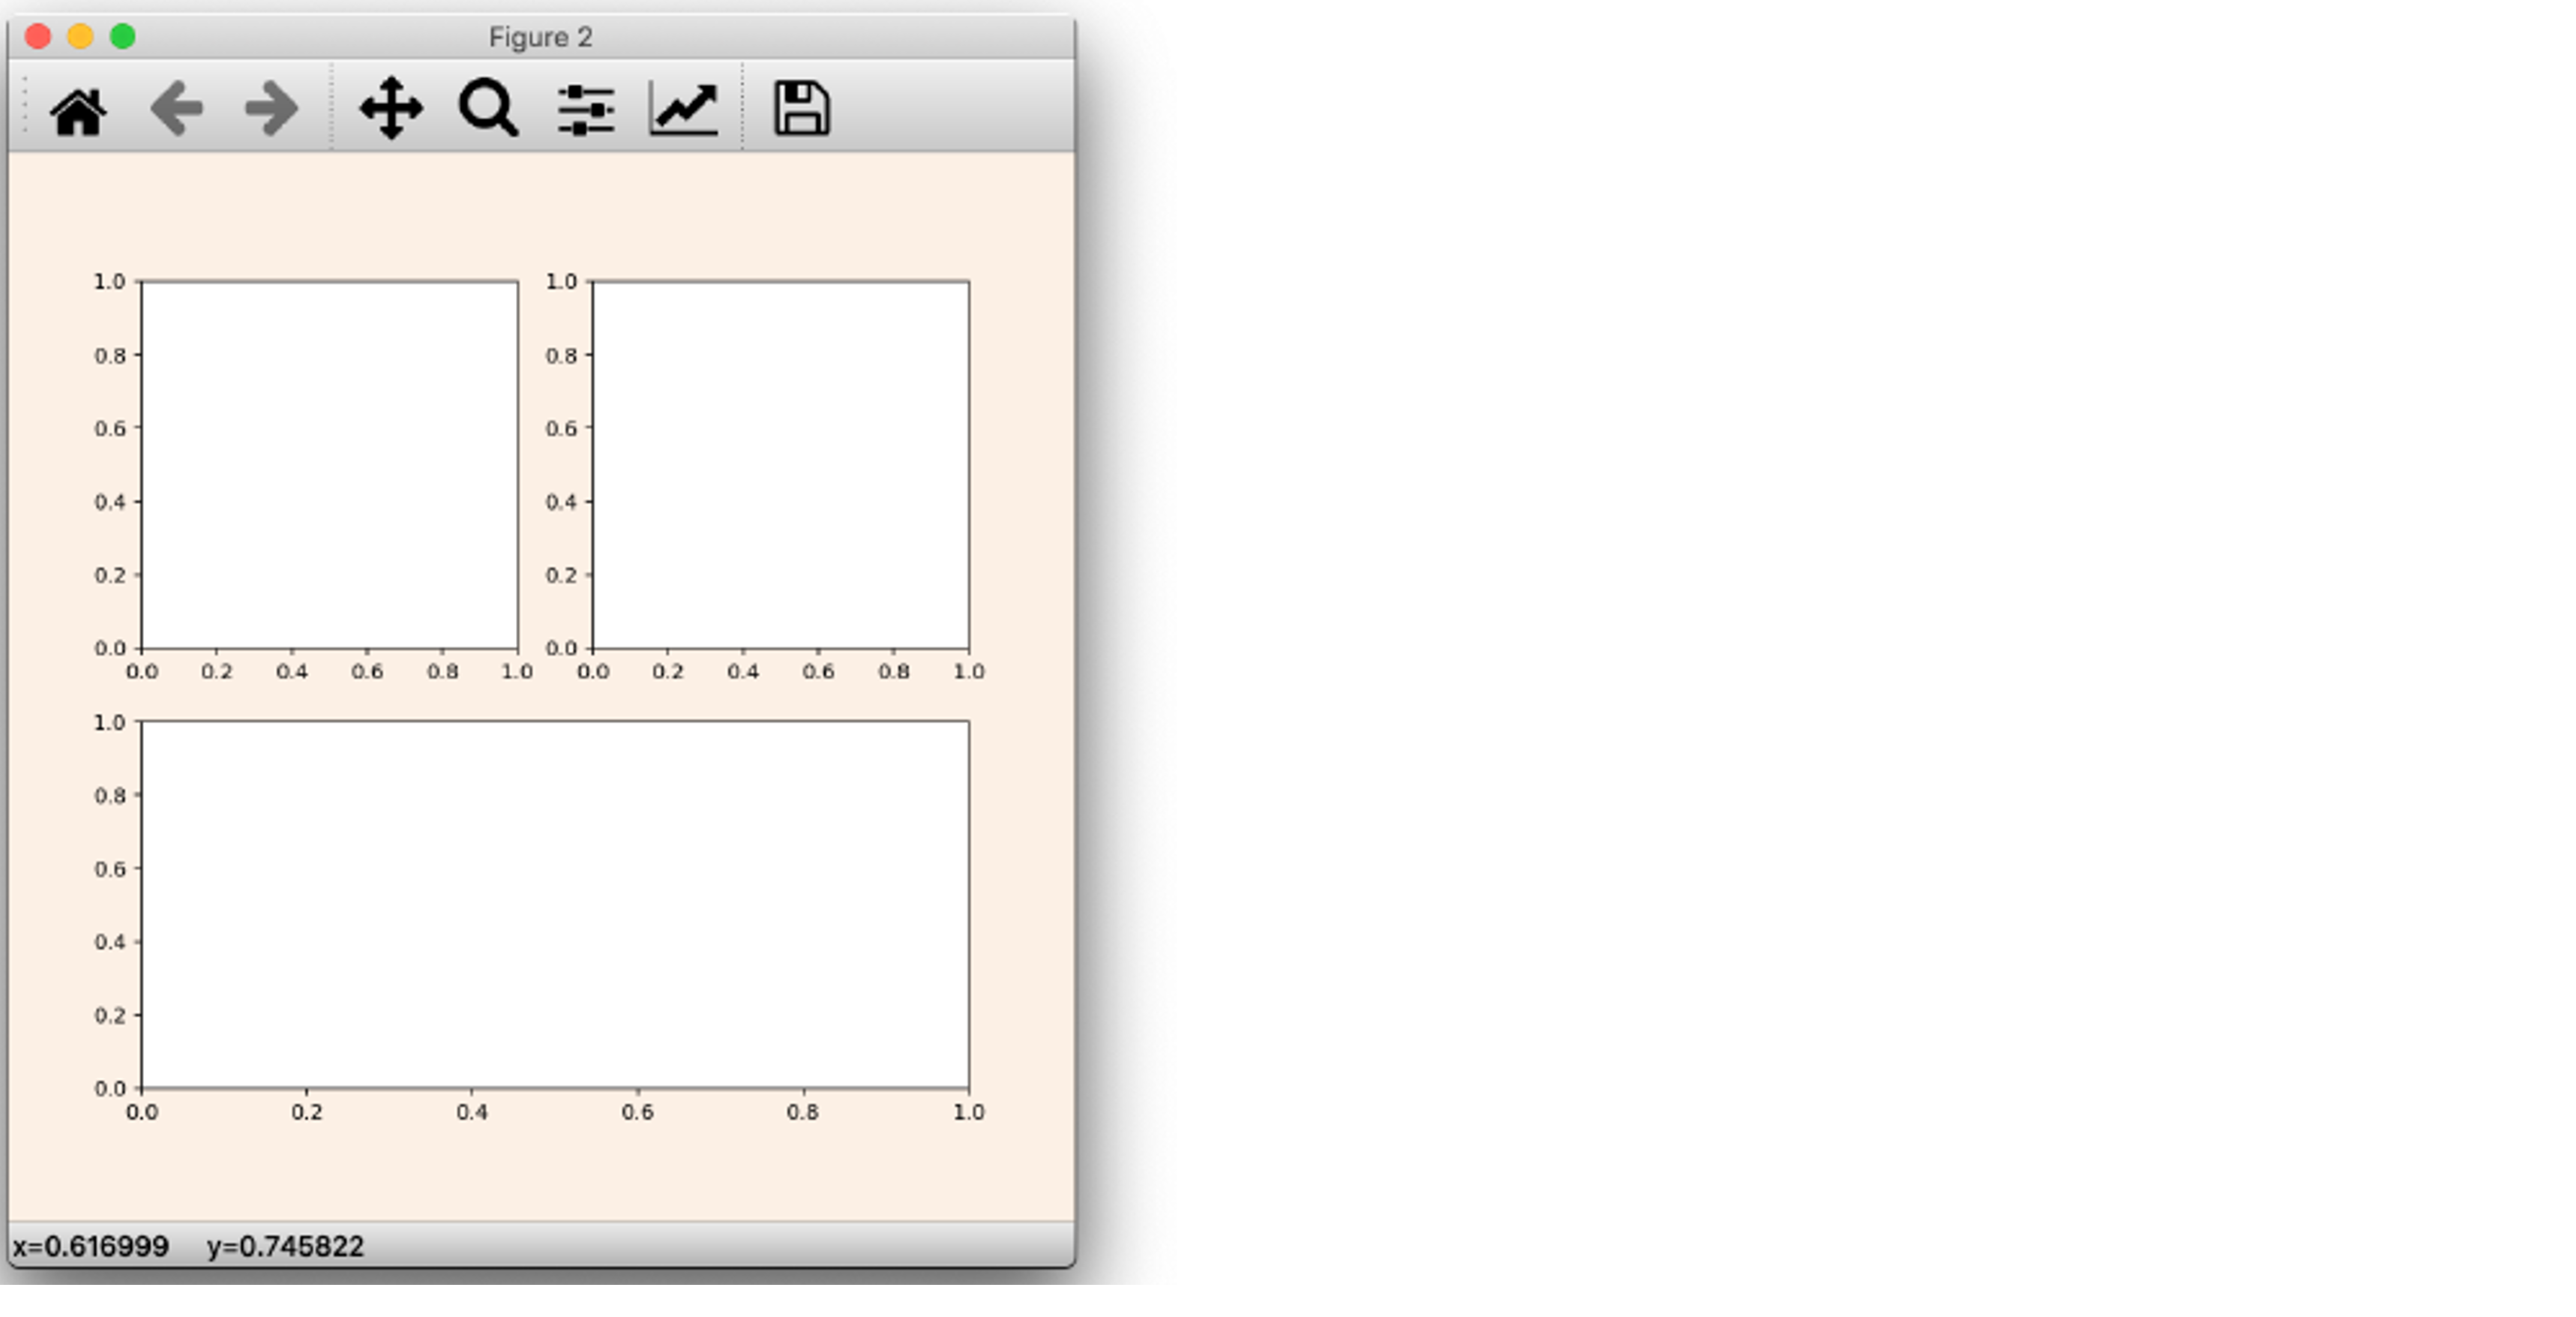
이번엔 조금 더 응용해서 일정하지 않은 간격을 갖는 axes를 만들어 보자
ax1 = fig.add_subplot(221)
ax2 = fig.add_subplot(222)
ax3 = fig.add_subplot(212)
add_subplot()도 여러가지 키워드 가변 인자를 줄 수 있다.
너무 많아서 여기 다 적을 수는 없고 필요할 때 Matplotlib docs에서 보는 것이 좋을 것 같다.
예시는 다음과 같다.
fig = plt.figure()

fig.add_subplot(231)
ax1 = fig.add_subplot(2, 3, 1)  # equivalent but more general

fig.add_subplot(232, frameon=False)  # subplot with no frame
fig.add_subplot(233, projection='polar')  # polar subplot
fig.add_subplot(234, sharex=ax1)  # subplot sharing x-axis with ax1
fig.add_subplot(235, facecolor="red")  # red subplot

ax1.remove()  # delete ax1 from the figure
fig.add_subplot(ax1)  # add ax1 back to the figure
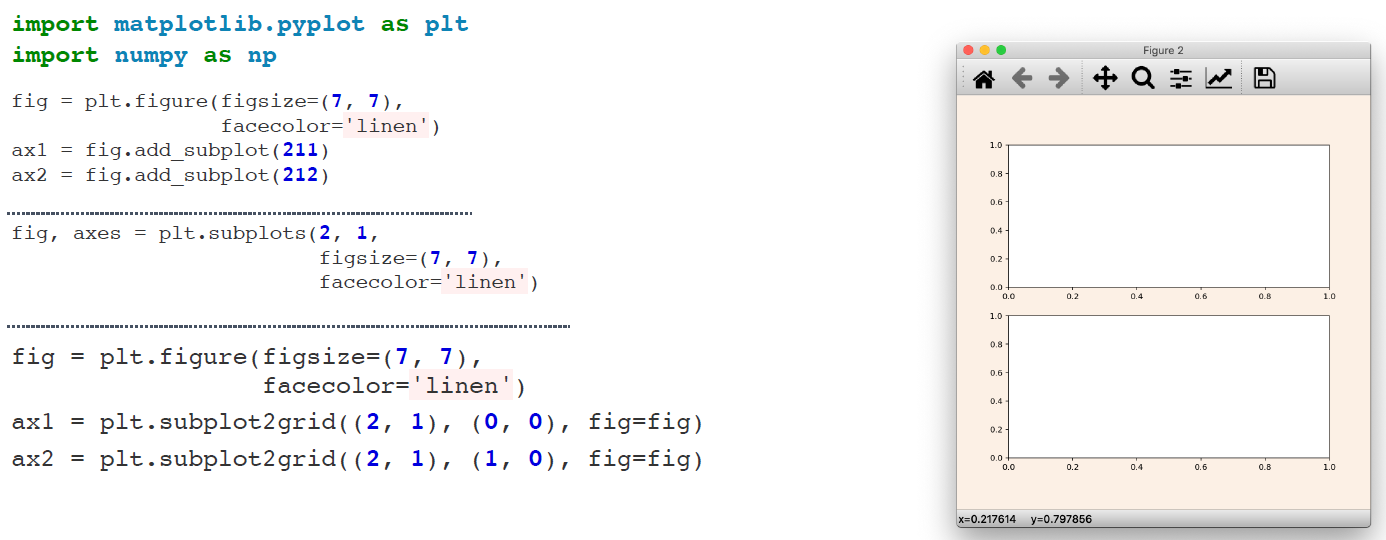
근데 이와 같이 도화지를 생성하고, subplot을 더해주는 방식을 하나로 만드는 방법이 있다.
3. Easier way
# 기존 방법
fig = plt.figure()
ax1 = fig.add_subplot(211)
ax2 = fig.add_subplot(212)

# 더 쉬운 방법
fig, axes = plt.subplots(nrows=2, ncols=1)

ax1 = axes[0]
ax2 = axes[1]

# 더 더 쉬운 방법
fig, (ax1, ax2) = plt.subplots(2, 1, figsize=(7, 7))
# 2D axes의 경우에는 받아온 axes를 1차원으로 펼쳐줘야 편하다
fig, axes = plt.subplots(nrows=2, ncols=2)

# axes의 타입은 ndarray이다 -> flat() 메소드를 쓰면 편하다
axes = axes.flat()
참고로 이 방법으로는 일정하지 않은 간격을 갖는 axes를 만들 수는 없다. 그래서 각각 장단점이 있다고 할 수 있다.
4. More Complex Arrangement
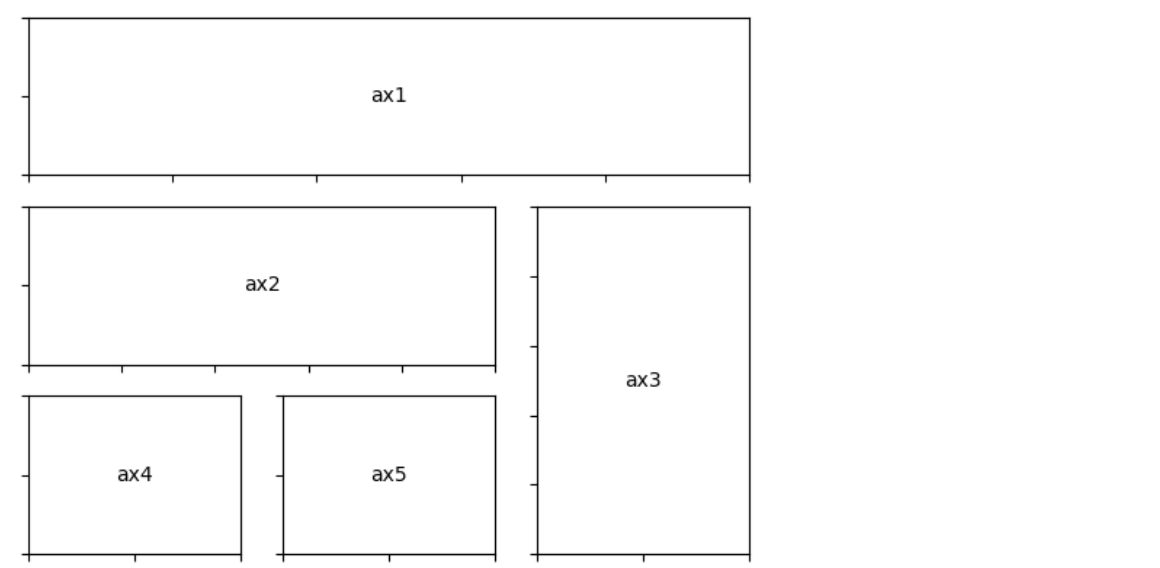
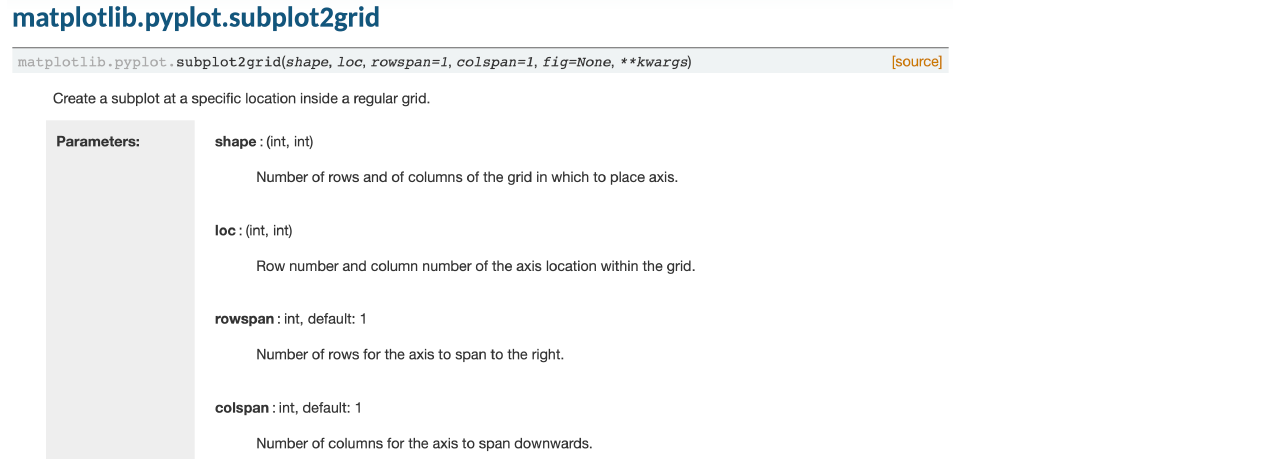
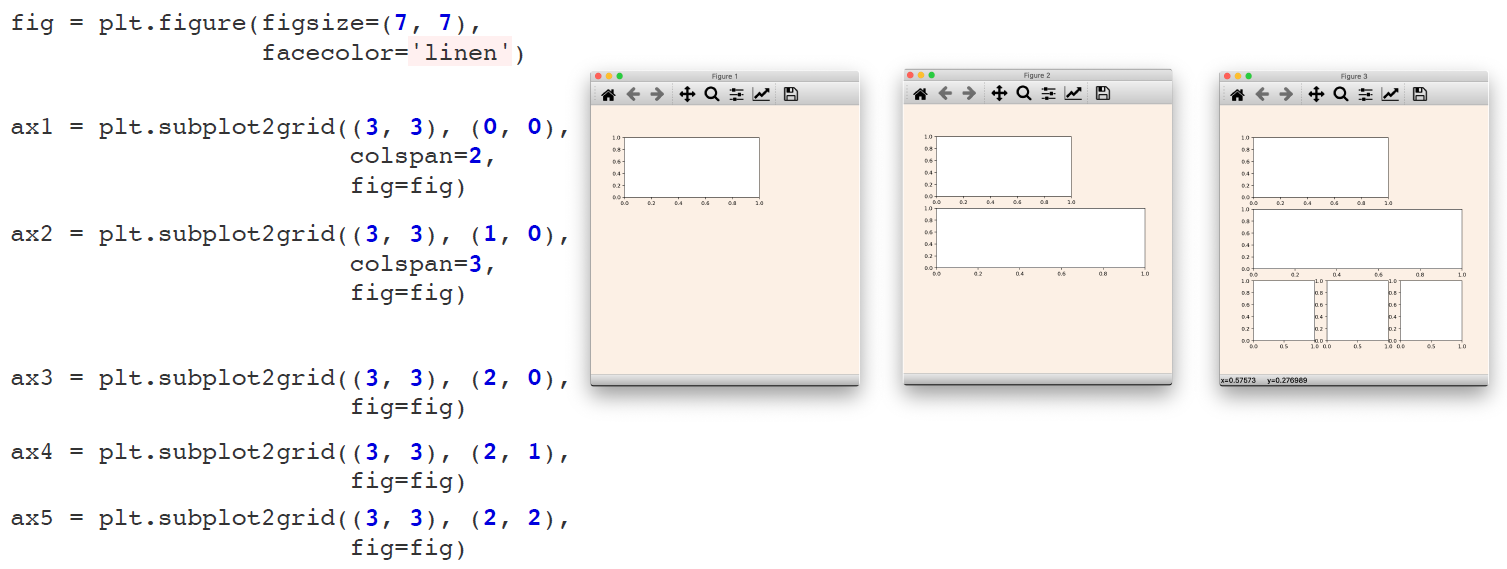
정리하면 Figure에 axes를 정하는 방법은 크게 3가지 정도가 있다.
5. Most free way
이 방법은 내가 그린 ax 위에, 옆에, 안에 새로운 ax를 넣을 수 있다. 다음 그림은 예를 든 모습이다.
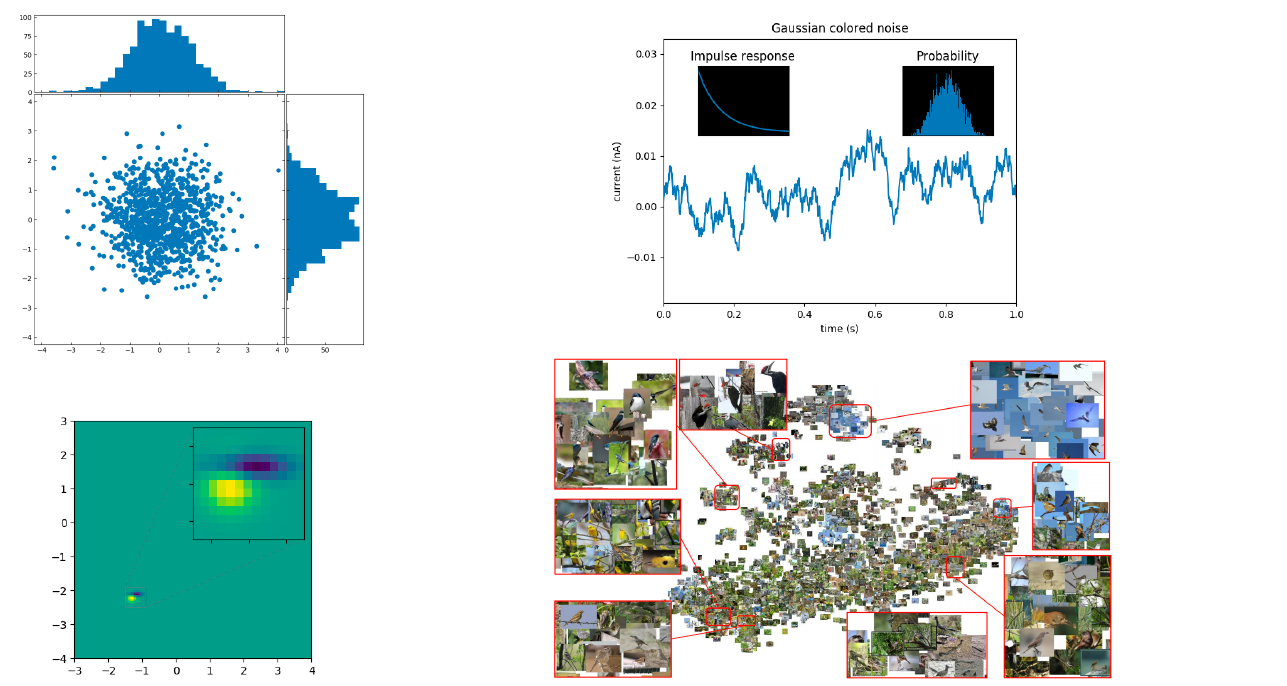

left, bottom은 그림의 왼쪽 하단 모서리를 지정하는 것이다.
