
1. Figure와 Axes 제목 달기
fig, ax = plt.subplots(figsize=(7, 7))
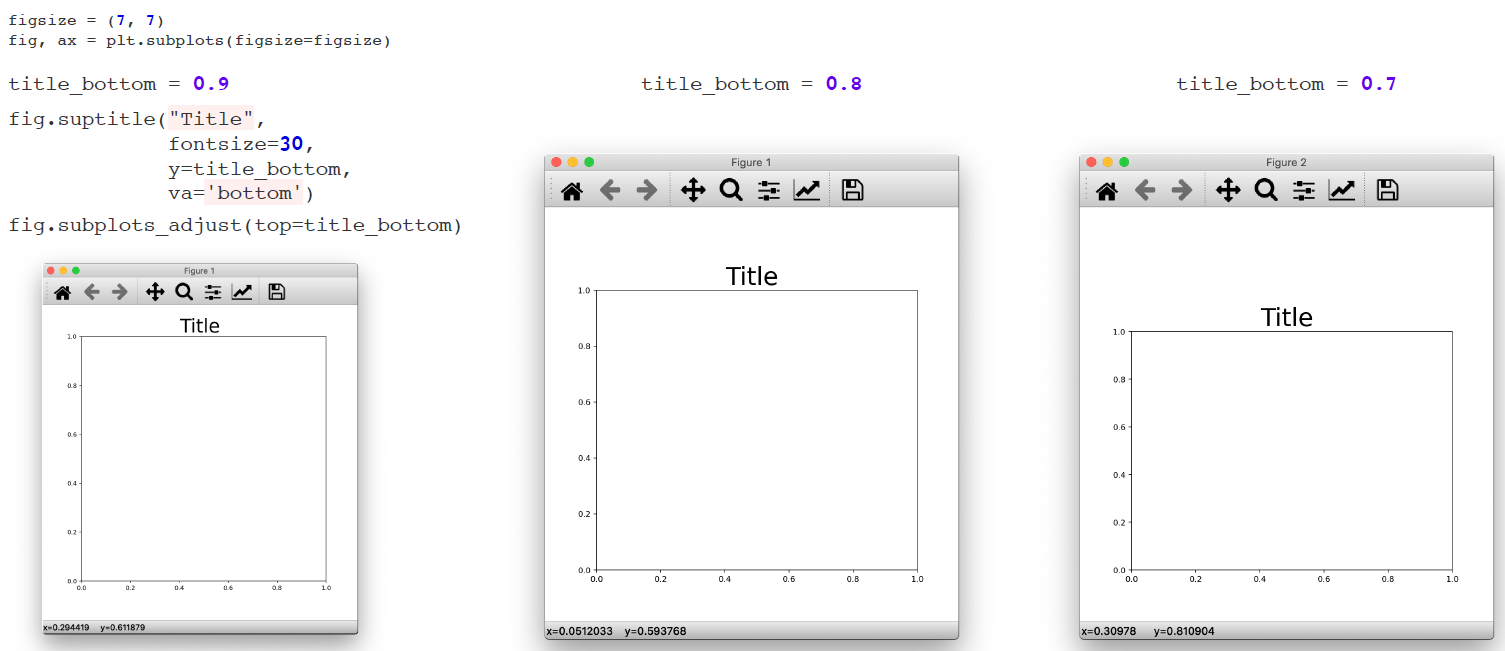
# Figure 제목 달기 ( 잘 사용 안함)
fig.suptitle("Figure title", fontsize=30, fontfamily='monospace')
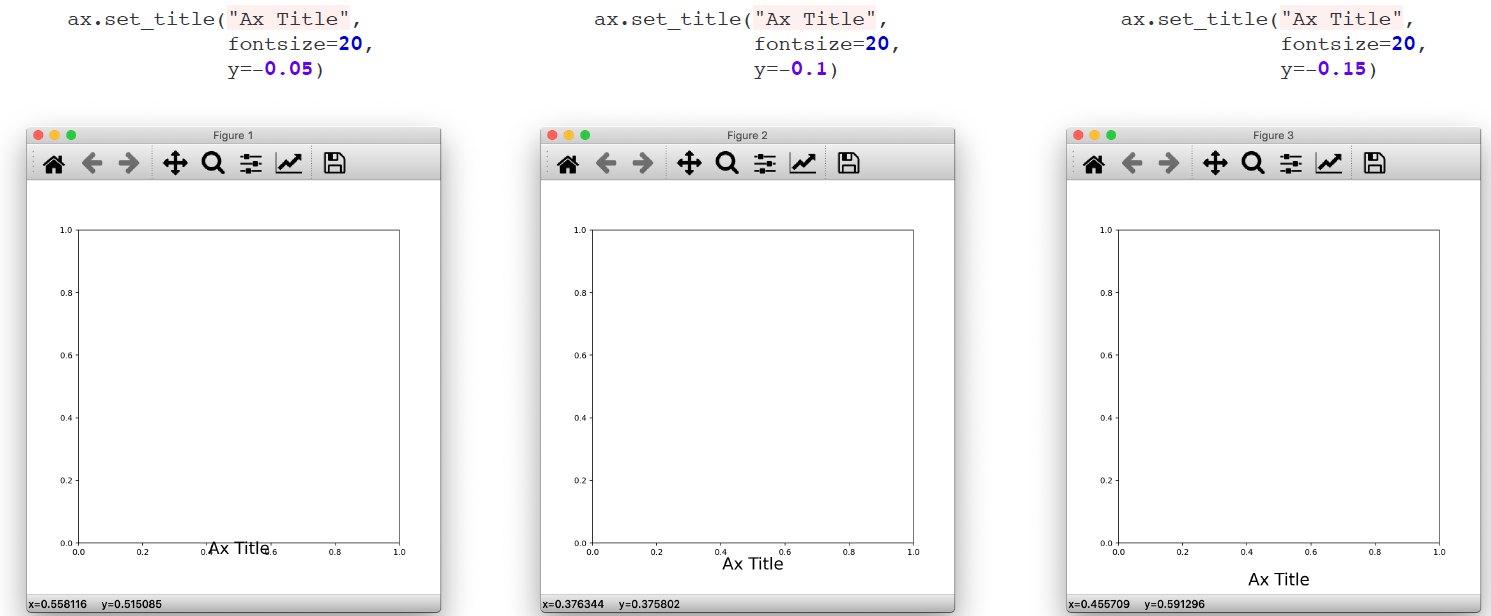
# Axes에 제목 달기
ax.set_title("Ax title", fontsize=30, fontfamily='serif')
# alpha는 투명도
ax.set_xlabel('X', fontsize=20, color='darkblue', alpha=0.7)
ax.set_ylabel('Y', fontsize=20)
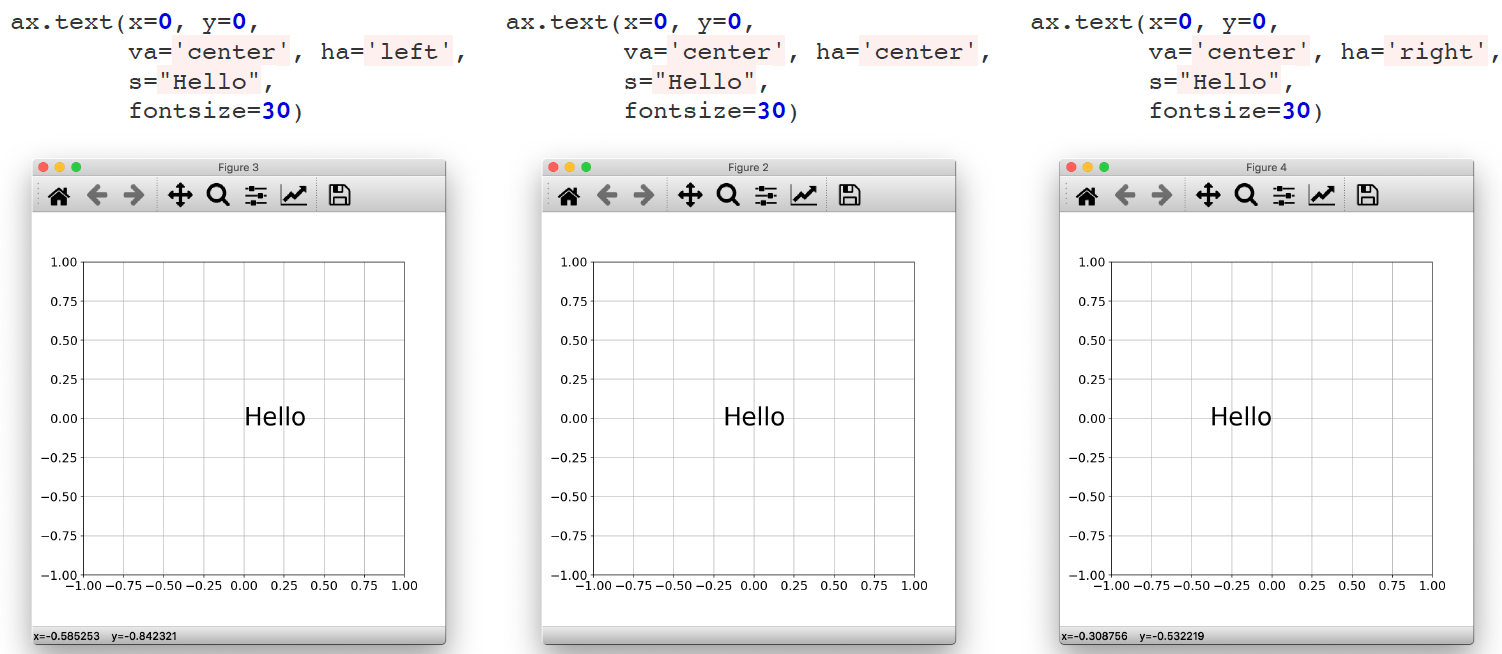
2. Text Alignment
1) Text Alignment
# (0, 0)에 글자의 vertical center 와 horizontal center가 위치한다
ax.text(x=0, y=0, va='center', ha='center', s ='Hello', fontsize=30)
2) Title Alignment
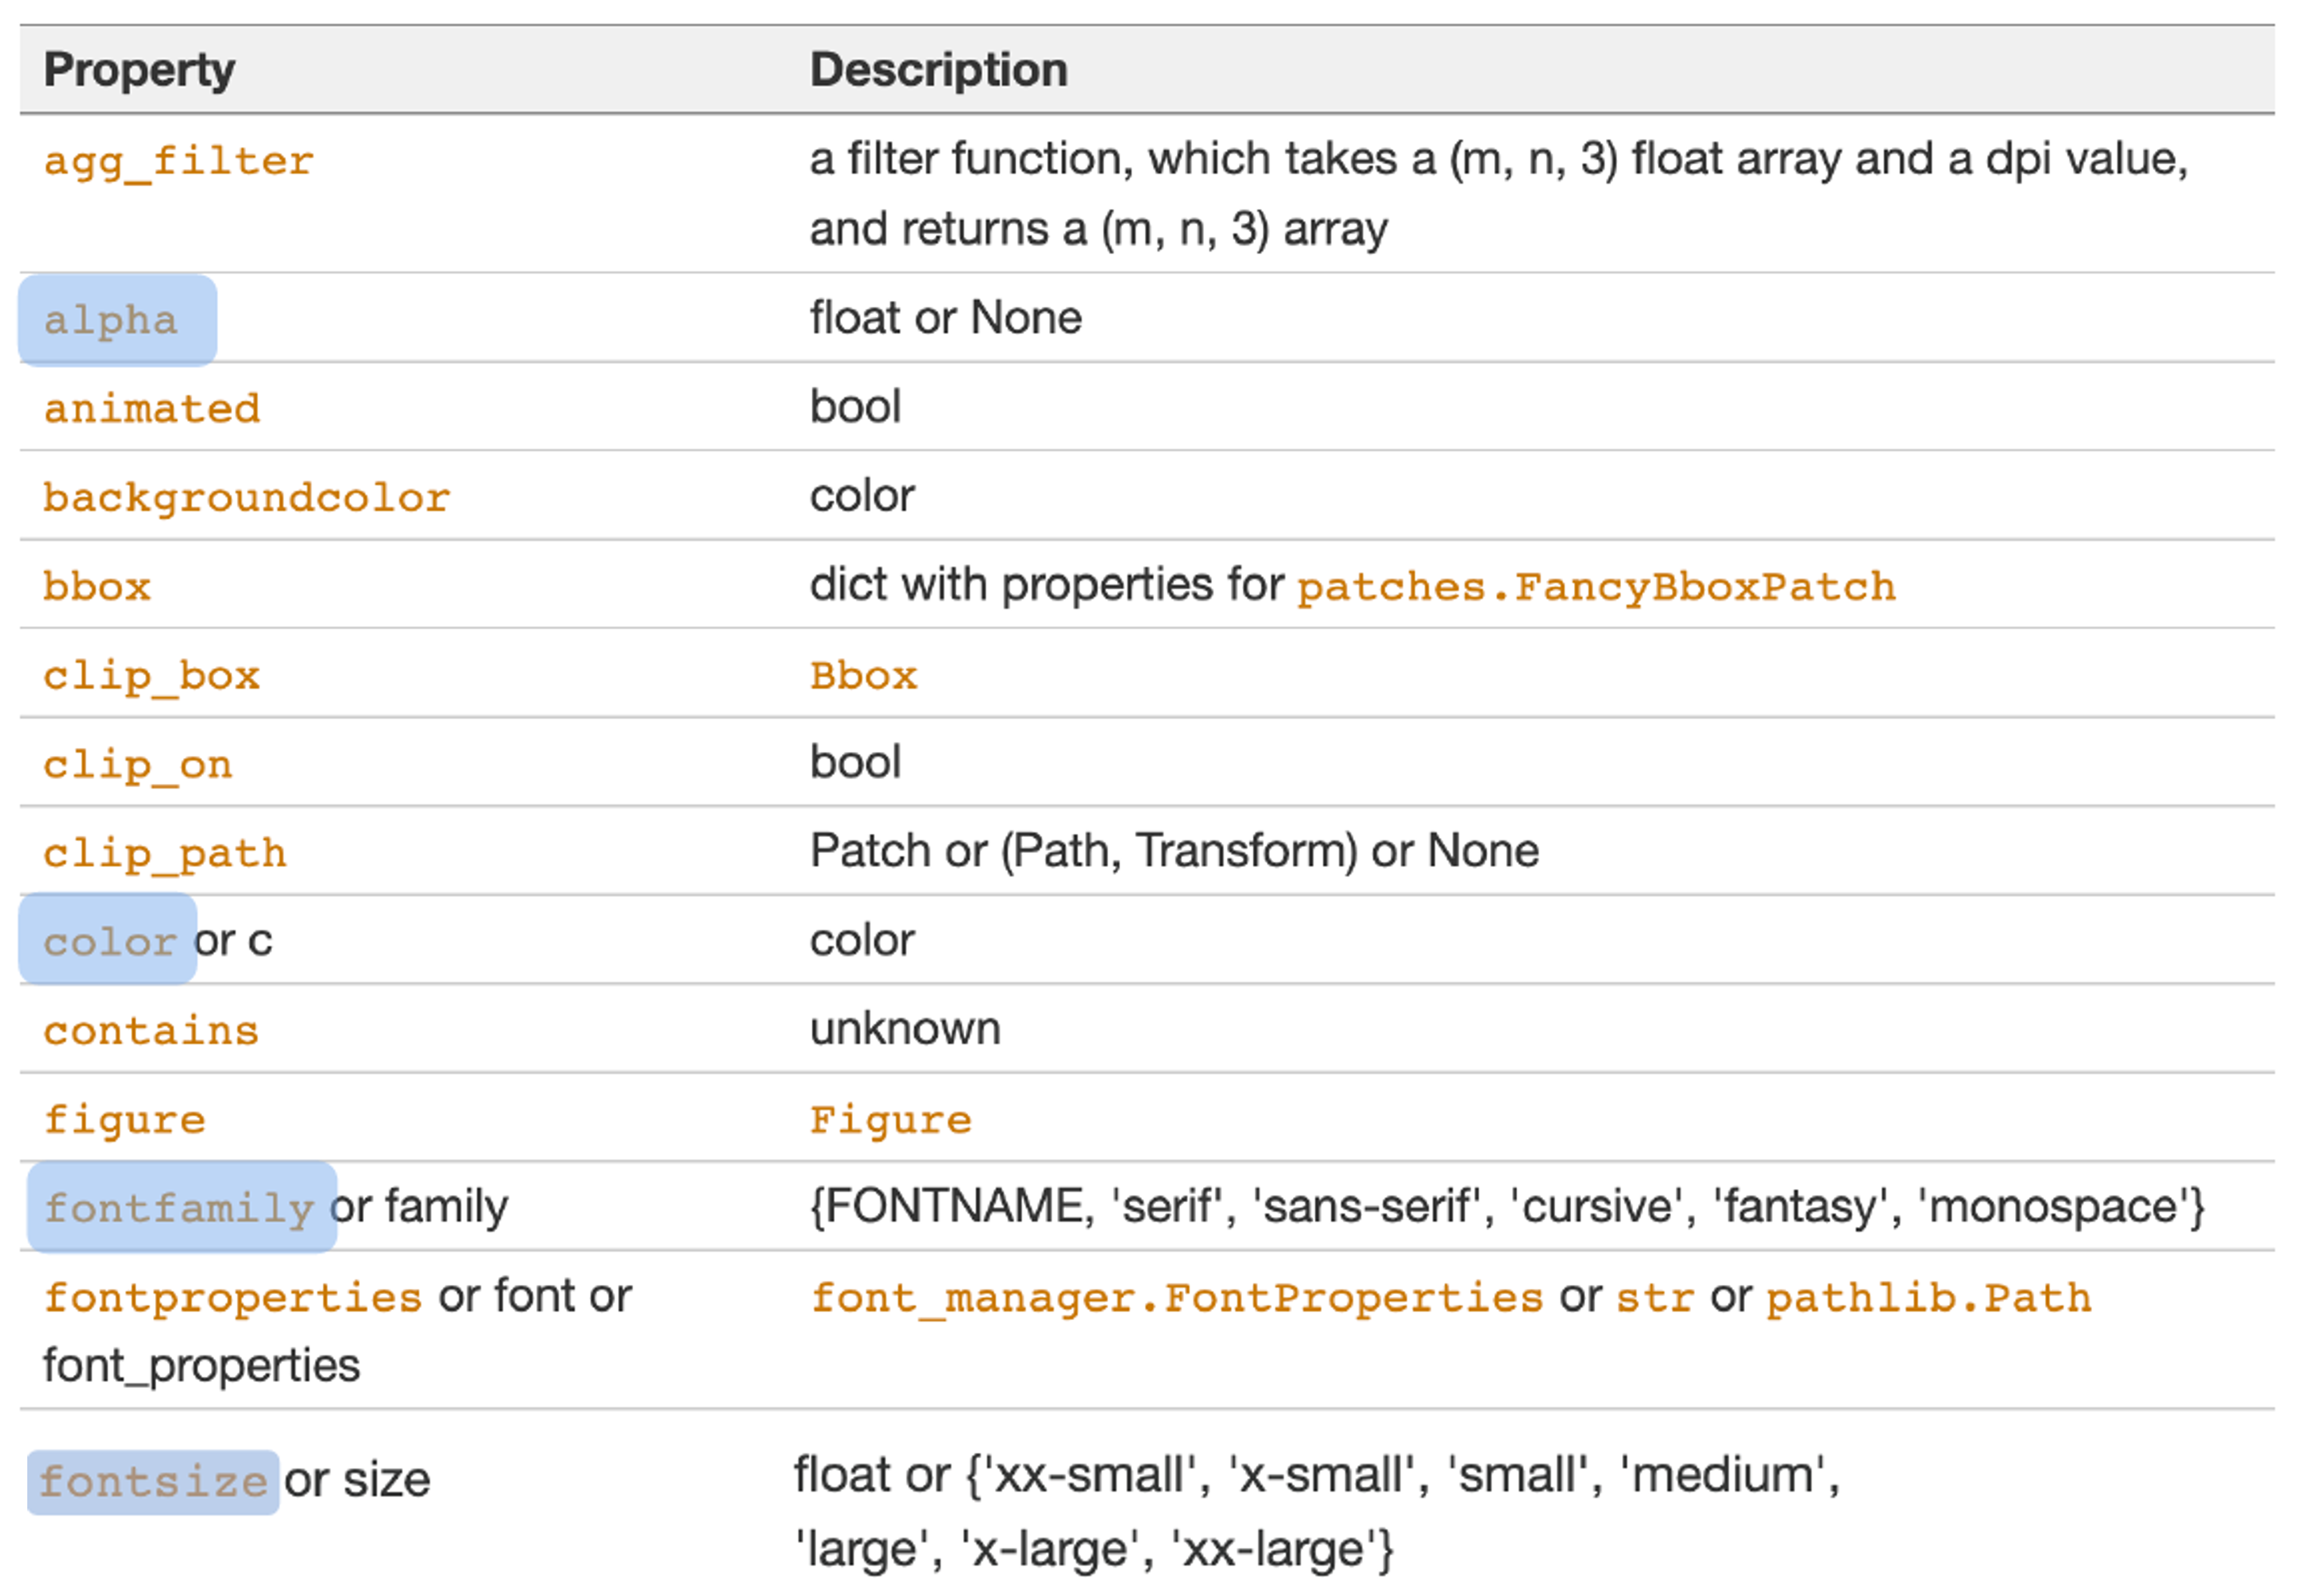
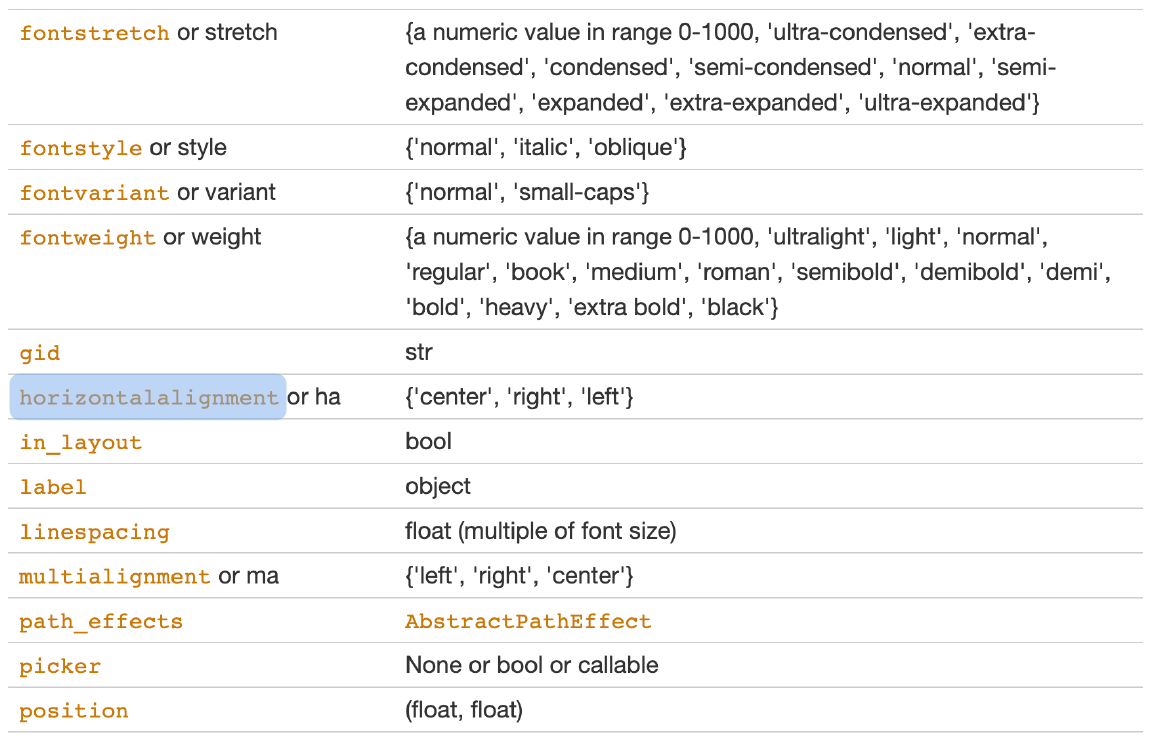
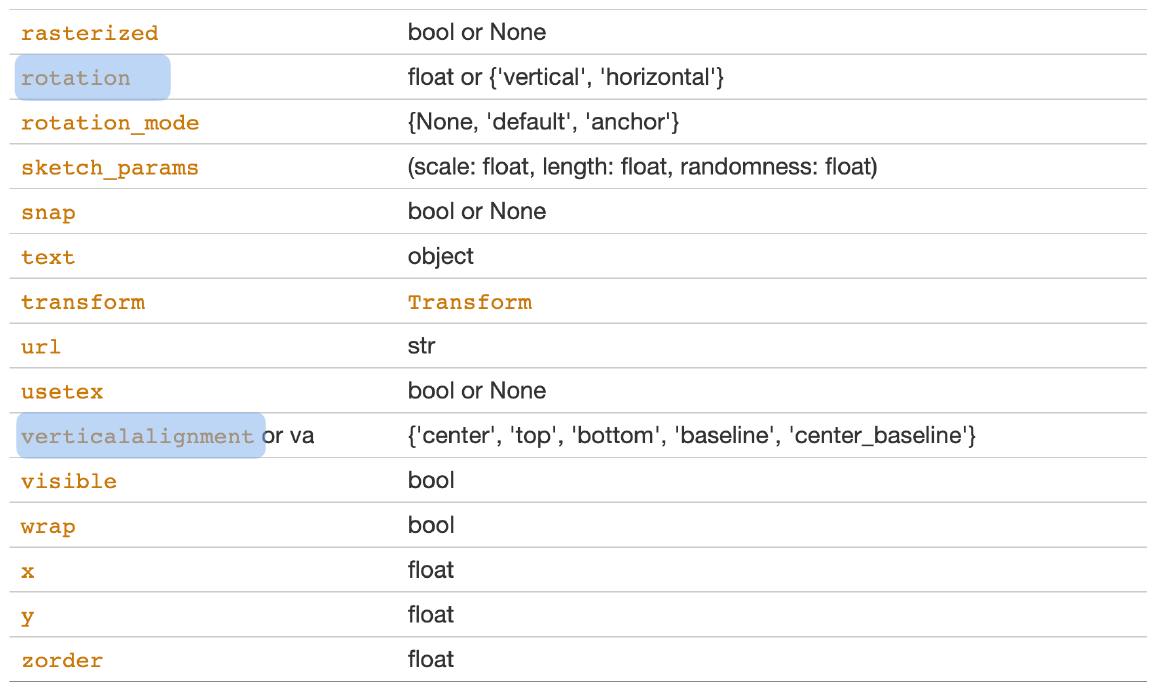
3. Text Properties
4. Font Dictionary
정리해보면 ax 하나에 대표적으로
-
ax.set_title()
-
ax.set_xlabel()
-
ax.set_ylabel()
-
ax.text()
이렇게 4가지가 있다. 그럼 만약 Figure에 6개의 그림이 있다면..? 1개의 그림마다 저렇게 4개를 설정해주게 되면 코드가 엄청길어지게 된다.
이런 점을 해결해주는 방법이 있다. 그게 바로 fontdict라는 인자인데, 설정해주고 싶은 값을 dict형태로 저장해두고 각 그림들에 적용만해주면 된다.
title_font_dict = {'fontsize': 30, 'fontfamily': 'serif', 'color': 'darkblue', 'alpha': 0.8}

xylabel_font_dict = {'fontsize': 20, 'color': 'darkblue', 'alpha': 0.6}

text_font_dict = {'fontsize': 20, 'color': 'r', 'fontweight': bold}
ax1.set_title("Title1", fontdict=title_font_dict)

ax2.set_title("Title2", fontdict=title_font_dict)

ax1.set_xlabel("Data Index", fontdict=xylabel_font_dict)
...